Stock charts or price charts are a fundamental tool that every investor should be familiar with. Here’s a quick guide explaining how to read a stock chart, and stock chart terms and patterns to know.
What is a stock chart?
A stock chart is a tool that shows the price movement of a stock over time. It is one of the most commonly found tools when discussing stock price movements and trends over time.
You may come across different types of stock charts, with some being more sophisticated and having more components and data points than others.
But at its most basic, a stock chart is comprised of a few components – the horizontal x-axis that denotes time; the vertical y-axis that denotes price, and the trend line. There should also be the name and/or ticker symbol of the stock.
Depending on the platform you use to look up a stock chart, you may find other useful information such as market cap, volume, dividend, and P/E ratio – data points that help investors understand the stock.
Advanced platforms such as TradingView even allow you to make drawings and use analysis and charting tools on stock charts for more in-depth evaluation of a stock.
How to read stock charts
Stock charts are ubiquitous, and anyone can look up a stock chart at any time. For instance, here’s a stock chart from Google Finance.
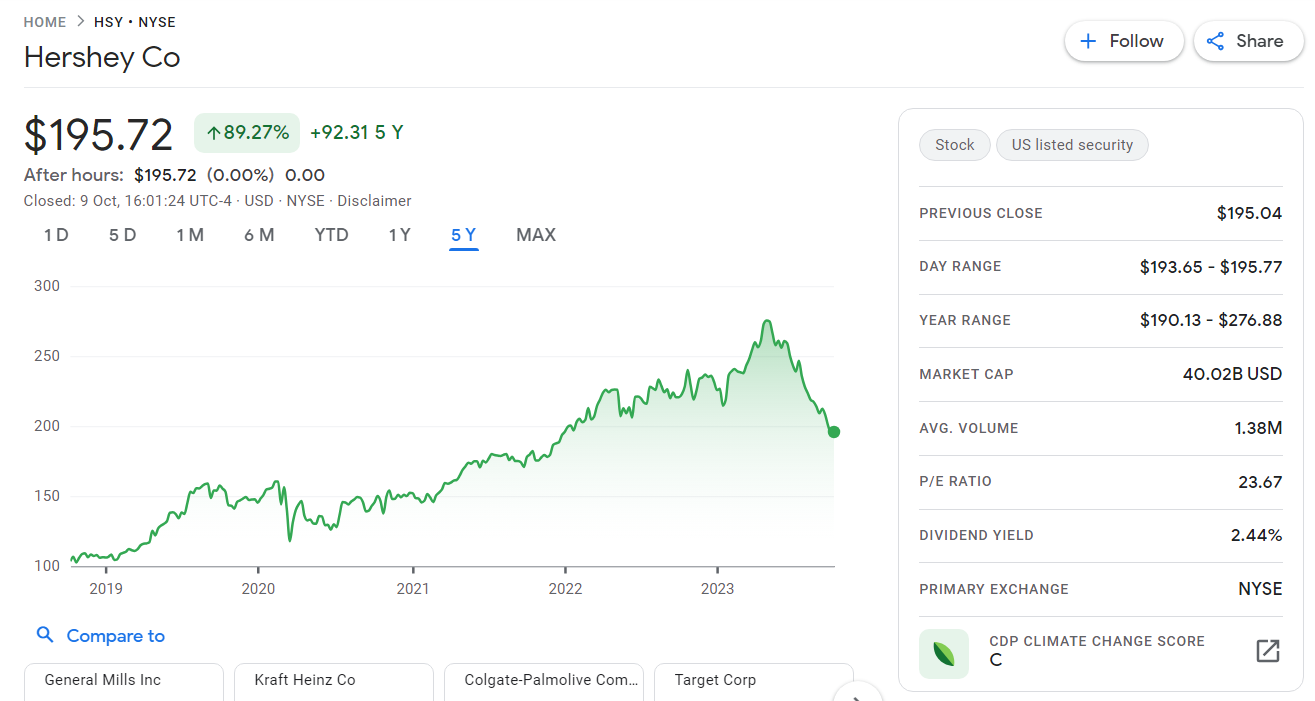
In the top left corner, we see the name of the company (Hershey Co) and also the ticker symbol (HSY). NYSE here denotes where the stock is listed, in this case the New York Stock Exchange.
Just below the name is the price of the stock, which is US$195.72 at the time of writing. Next to the gain/loss, which changes according to the time period used for comparison, directly below.
In this case, notice that the time period is set to 5 years (5Y), and +89.72% in green is seen next to the price. This means that the current stock price of Hershey is 89.72% higher compared to 5 years ago. You can select different time periods ranging from one day to maximum to see how the current price compares.
The squiggly line in green is a visual representation of the price movement during the five-year period. This price line changes as you select different time periods for comparison.
To the right of the stock chart, Google has provided additional information regarding the stock. This includes price information such as the previous closing price, the one-day range, and the one-year range. Also included are other information such as market cap, P/E ratio and more, which we’ll discuss later.
As you can see, stock charts are fairly intuitive and easy to read, so don’t be afraid to look up your favourite stocks on Google to familiarise yourself with them. You’ll also find earnings figures and other essential information about the company further down the page.
A note about price lines
Google Finance uses a simple line drawing to represent price levels. but there are also two other ways to denote price on stock charts. Let’s take a closer look at the differences between the three – line charts, bar charts and candlestick charts.
Line chart
Line charts use a single line to plot the price of a stock over time. It is the simplest of the three, and may be used to illustrate trends, as well as the price of the stock at the close of each trading day or period. They are best suited for getting an overview of a stock’s price movements.
Bar chart
In a bar chart, each trading period is represented by a single vertical line. There are also short horizontal lines near the top and bottom of the vertical line.
Here’s how a single bar looks.
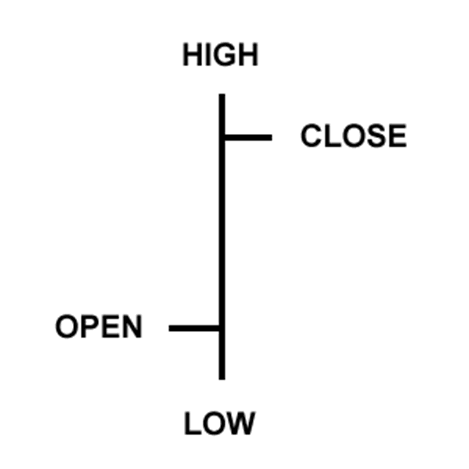
Each of the four points of the bar represents a piece of price information, as follows:
- High: The highest price of the stock during the trading period
- Low: The lowest price of the stock during the trading period
- Open: The price of the stock at the start of trading
- Close: The price of the stock at the end of trading
Between these four data points, a bar chart can tell us things like price volatility (the length of the vertical line) and market sentiment (the distance between Open and Close).
Of course, a bar chart doesn’t just consist of one single bar. It is made up of several bars lined up in succession, resulting in something like this:
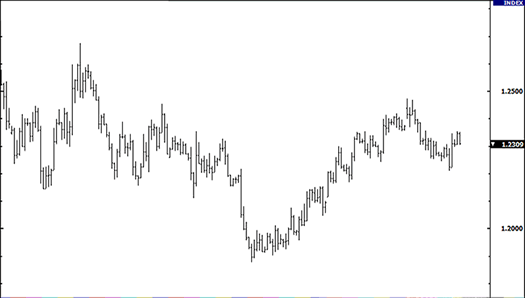
Much like a line chart, bar charts can also indicate price trends, while providing a more granular level of information regarding price.
Candlestick chart
Bar charts are great, but not necessarily the easiest to read, especially compared to the candlestick chart, which you may think of as an “evolution” of the bar chart.
Instead of simple lines, candlestick charts are made up of solid bars (the candle) with vertical lines (the shadow or wicks) above and below, resembling a candlestick. The body can also be coloured differently to help distinguish whether the stock price ended the day up or down.
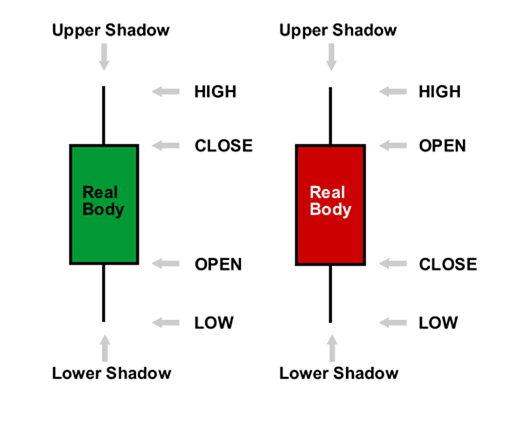
Similar to bar charts, candlestick charts also offer four data points: High and Low (referring to the highest and lowest prices seen during the trading period) and Open and Close (indicating the prices at which the stock opened and closed the trading period). Additionally, a green candlestick indicates the stock ended the day with a higher price, while a red one denotes the reverse.
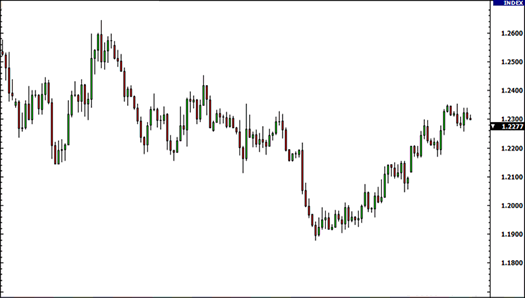
As you can see from the example above, candlestick charts are able to convey more information while remaining highly readable. This is why candlestick charts are among the most popular formats when displaying stock charts.
Stock chart terms to know
Now that you understand the basics of stock charts and how to read one, let’s discuss some common stock chart terms you are likely to encounter.
Market cap
Short for “market capitalisation”, this is the total value of a company’s stocks and shares, derived by multiplying the share price by the total number of outstanding stocks.
Market capitalisation is also used as shorthand for the size of a company. Apple is considered a giant in the tech industry not because of its workforce but because of its trillion-dollar market cap.
P/E Ratio
The Price-to-Earnings ratio is often used by inventors to gauge whether a stock is worth its current price. This metric compares the company’s stock price with its earnings-per-share and is one of the first things many inverters look at when researching a stock.
There is no standard P/E Ratio that is considered positive or negative. Rather a stock’s P/E Ratio should be considered in the context of its sector; how high or low is it compared to its peers.
Also, growth stocks tend to have higher P/E Ratios, whereas value stocks tend to have lower P/E Ratios, but exceptions are always possible.
Dividend yield
Many, but not all, companies share their profits with shareholders in the form of dividends, which are paid on a per share basis. For instance, if ABC Inc. declares dividends of US$2 for the year, you will be paid US$2 for every share you hold.
Rather than the dollar amount, stock charts indicate dividend yield instead – this is the yearly dividend amount expressed as a percentage of the current stock price. Dividend yields are an important consideration amongst investors, and dividend yields that increase at reasonable rates are seen as a sign of a healthy company.
Average volume
Average volume refers to the trading volume of a stock, which is an indicator of the number of shares traded during the trading period.
This metric can help an investor gauge the liquidity of the stock. When average volume changes drastically within a short time, it also indicates high volatility and that stocks are switching hands at a high pace.
Primary exchange
This indicates which country the stock is listed, which can impact trading hours and tax obligations, among others. For example, if a stock is listed on the New York Stock Exchange (NYSE), you’d have to follow NYSE trading hours to trade the stock.
Conclusion
In this article, we’ve explained the basic components of stocks charts as well as some common terms. Hopefully what was once a mess of lines and numbers has now become much more comprehensible.
You can further increase your skills with stock charts by looking up chart patterns and charting tools. Incidentally, knowing how to read stock charts is a core skill in technical analysis, so you’ll be building your foundational skills as you learn more.