
CHINA50 vs HK50: Momentum Meets Reality in Asia’s Markets

For retail traders tuning into Asia’s equities, the CHINA50 and HK50 provide compelling yet contrasting snapshots of market sentiment. Broadly speaking, these Asian indices have benefited from bullish sentiment as locals move away from fixed-income products and toward equity markets as risk appetite improves. This is a welcome sign after years of underperformance since the housing market meltdown in China years ago.
However, this rally needs to be taken with some caution, given the macroeconomic backdrop in China. China’s economy is cooling, with July’s industrial output and retail sales growth slipping to their weakest since last year. Real estate remains under pressure, which has been a key source of concern in local markets.
For many market participants, this sets up some tension in the financial markets, where equity momentum is strong, but fundamentals are flashing caution. It would thus be prudent to continue keeping an eye out for macroeconomic data releases even when locally domiciled companies in China continue to post good earnings results and positive growth outlooks.
CHINA50 – Some Hesitation is Seen
The CHINA50, which tracks the 50 largest and most liquid Chinese companies listed in Hong Kong, has been on a remarkable run. Heavyweights like Tencent and Alibaba have been buoyed by renewed flows and easing trade tensions, with funds rotating back into Chinese megacaps. Nevertheless, some hesitation can be seen amidst the backdrop of a slightly weakening economy, which is evident in price action as shown below.
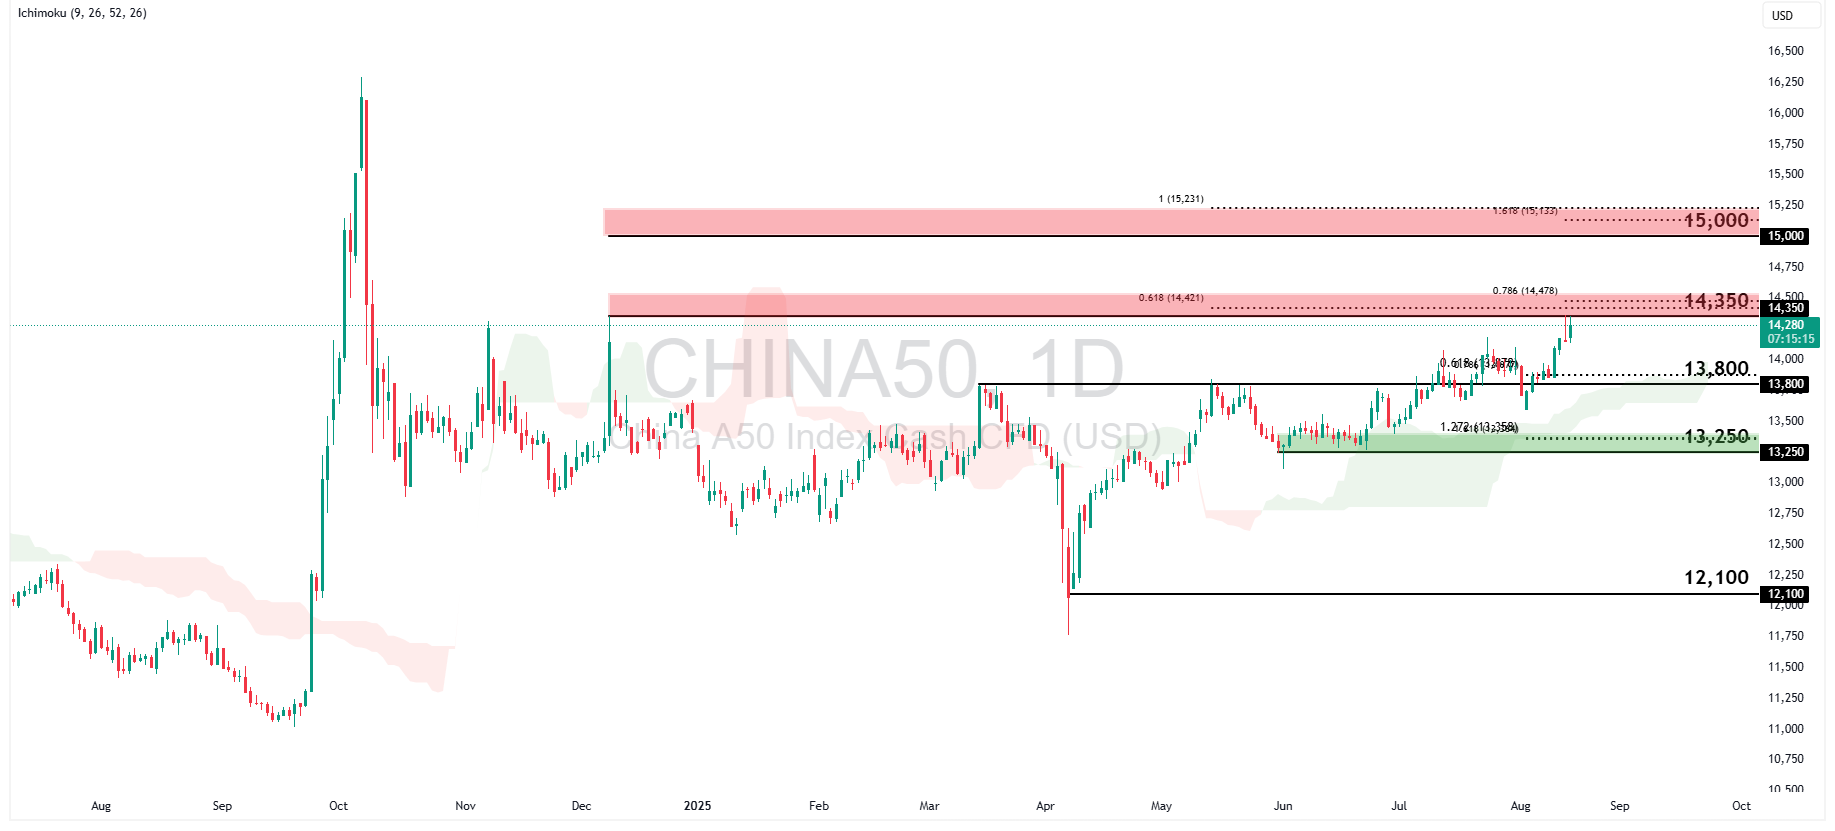
CHINA50 is currently testing the 14,350 resistance level, which is in line with a swing high resistance and both 61.8% and 78.6% Fibonacci Extension levels. Here, there could be some resistance against the move higher in the price should this level hold. We could then see a retest of the 13,800 support level, which is a pullback support level in line with the 61.8% Fibonacci Retracement and 78.6% Fibonacci Extension levels.
However, a convincing break-and-close above this resistance could indicate strong bullish momentum continues to hold in the Chinese equities market, in which case the price could move higher towards the 15,000 resistance level, in line with an area of strong Fibonacci confluence.
HK50 – Bullish Momentum Prevails
On the other hand, the HK50 is offering a steadier ride for those interested in Asian equities. The Hang Seng Index has been on a bullish trend, as evidenced by the price action shown below. Covering some of Hong Kong’s and mainland China’s biggest companies, the HK50 serves as a broad barometer of market sentiment in the region.
Recent bullishness in Hang Seng futures and a pickup in IPO activity suggest underlying confidence is rebuilding. Overall, Hong Kong continues to be the gateway for many international players in financial markets to access China’s financial markets. Hence, the two indices are closely linked, even as the base of who is interested in them differs.
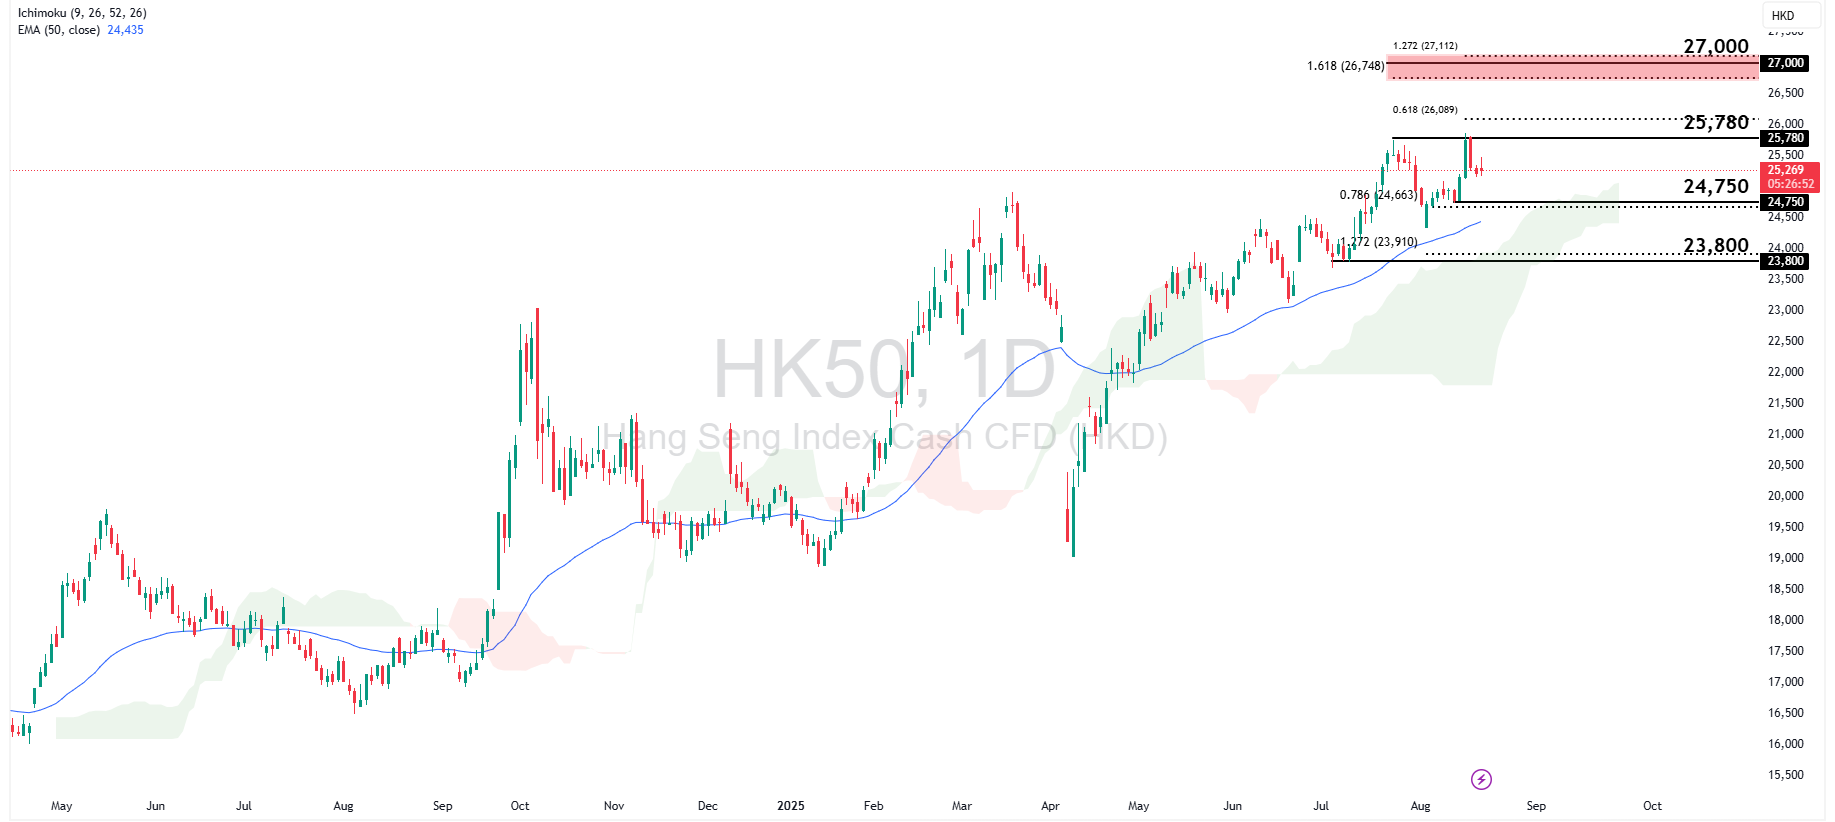
HK50 is showing strong bullish momentum as it now holds comfortably above the Ichimoku cloud and 50-EMA. In this setting, we could see the price bounce at the 24,750 support level, which is in line with the Ichimoku cloud and 78.6% Fibonacci Retracement level, before making a further move towards the upside to test the 25,680 swing high and 27,000 resistance in line with an area of Fibonacci confluence.
However, hesitation in bullish sentiment could also cause the price to retrace more than expected, in which case we could see the price test lower support levels, such as the 23,800 swing low support, in line with the 127.2% Fibonacci Retracement level.
All in all, while equity indices may paint a rosy picture of Hong Kong’s and mainland China’s financial market performance, a closer look must be taken to understand the local economy’s performance. Continue to keep a lookout for macroeconomic data releases that may reveal hints as to how Asian markets are keeping up with big changes driven by the West.
